Multimodal Health Sensing

Designing systems to support people in reconciling complex multimodal health data with their mental models

TL;DR

Connecting the Dots in Health Data

Most health apps treat the body as a set of disconnected parts. But health is interconnected and people want tools that help them understand how signals like sleep, mood, hormones, and energy relate over time.

This three-phase research and design project used menstrual tracking as a lens to explore how consumer health tools can better support holistic, goal-driven reflection.

Current Prototype Demo Video

100
Participants across 3 studies
190
Days of longitudinal research
3
Research phases
~90%
Data collection adherence

The Problem

People want to understand their health, not just track it.

Many people turn to health tracking tools in the hopes of understanding their bodies and achieving personal health goals. Yet most apps treat health as fragmented focusing narrowly on one domain at a time, like exercise, diet, or hormones.

Health doesn't happen in silos

This siloed design makes it hard for users to grasp the bigger picture, even though health reflects a complex interplay of hormonal, metabolic, emotional, and behavioral factors.

Current tools oversimplify complexity

Today's tools reduce that complexity to calendar dots and symptom logs leaving users to make sense of patterns on their own.

What I Did

🔬

End-to-End Research

Led UX research, design, app development, deployment, and evaluation across 3 project phases

📊

Multimodal Data Study

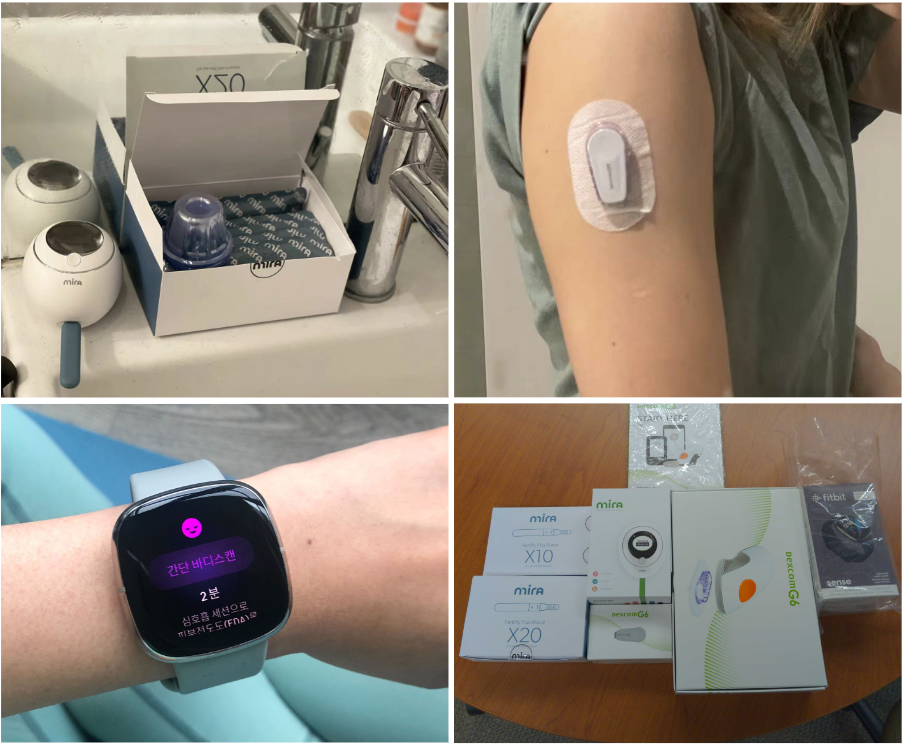
Studied how users track health signals with wearables (Fitbit, Dexcom, Mira)

🎨

Interface Design

Designed and tested new interfaces to support exploration, comparison, and pattern recognition

📱

Prototype Evaluation

Evaluated a custom prototype over 100 days to assess impact on health understanding

Choosing Menstrual Health as a Focus Domain

Menstrual cycles are complex, cyclical, and deeply personal making them a powerful lens for studying health sensemaking. Most period apps focus on predicting dates or logging symptoms but fail to help users draw connections between hormones and overall health.

Varied User Goals

  • Avoiding or achieving pregnancy
  • Preparing for days of menstruation
  • Managing symptoms such as chronic pain, mood changes, or fatigue
  • Determine health status and diagnosing hormone conditions
  • Learning how hormonal shifts impact wellbeing such as energy, sleep, stress, or focus
  • Increase body and health awareness

Research Advantages

Practical structure for health studies
Cyclical, semi-perdictable fluctuations provide checkpoints to observe tracking behaviors
Individual diversity
Goals can vary dramatatically overtime within and between individuals
Contains varying physiological contexts
Spans puberty, adulthood, pregnancy, postpartum, perimenopause, menopause

The Project

I established and led a design initiative across three phases:

01

Contextual Inquiry: Real-World Multimodal Tracking

Understanding current practices and pain points in cross-signal health reasoning

📍 50 participants ⏱️ 3 months 🔍 Contextual inquiry 📊 4 data streams

Research Goal

How do people engage with multimodal health tracking tools in everyday settings, especially when those tools offer unfamiliar or unconventional signals?

  • How and why users form questions and insights from varied data streams (hormone, glucose, sleep)
  • Where they experience breakdowns in cross-signal reasoning, reflection, or health literacy
Design requirements mapped to user goals

Methodology

Approach

3-month contextual inquiry with 50 menstruating participants using commercial tracking devices in their daily routines

Participants

50 menstruating individuals (ages 18-29, 8 ethnicities, diverse health tracking experience)

Tools & Data Streams

Tool Data Collected Rationale
Mira Estrogen (E3G), LH Hormonal fluctuations
Fitbit Sense Sleep, heart rate, stress Activity + recovery
Dexcom G6 Continuous glucose monitoring Metabolic signals
Custom App Mood, flow, pain, notes Context + symptoms
⚠️ Design Decision

Participants used native device apps, not a unified dashboard. This preserved real-world friction and revealed how users naturally reason across siloed interfaces. This way I can surface unmet needs in current tools without priming toward specific insights.

Data Collection

50
Pre-study interviews
187
Biweekly check-ins
40
Post-study interviews
90±22
Days of tracking per user
Analysis Process

Open Coding: Three researchers independently coded early transcripts line-by-line. Codes captured emergent ideas like "tracking beyond menstruation," "frustration with unexplained patterns," or "reliance on hormonal spikes."

Axial + Thematic Analysis: Grouped codes into mid-level categories and broader cross-cutting themes. Focused on shifts over time, contradictions between goals and behaviors, and interface design impact on interpretation.

Key Insights

1
How users form insights from varied data streams

Motivations: Anticipate symptoms, explore patterns over time, monitor long-term health changes, understand menstrual-wellness connections

Methods:

  • Tracking beyond menstruation days, especially around ovulation and hormonal peaks
  • Toggling between apps (Dexcom ↔ Fitbit ↔ Mira) to align and compare signals
  • Revisiting historical entries to verify recurring patterns or unexpected symptoms
  • Combining structured tracking with personal journaling when native apps lacked flexibility
2
Where breakdowns in reasoning occur
  • Fragmented apps, fragmented thinking: Switching between tools disrupted reasoning and increased cognitive load
  • "Data fatigue" limited exploration: Cognitive effort managing different signals caused users to default to familiar data types
  • Cross-signal reasoning rarely emerged: Tools lacked support for integrating streams, leaving users to "connect the dots" alone
02

Design & Prototyping: From Siloed Signals to Insightful Interfaces

Translating user needs into functional design requirements through interactive prototyping

📍 30 participants 🎨 2 prototypes 📝 Co-design sessions

Research Goal

How might we design interfaces that help people explore, understand, and act on multimodal health data in ways that feel insightful?

  • Derive clear design requirements to guide interface development for integrated, exploratory health tools
  • Test early concepts with users to validate design direction

🧪 Methodology

Approach

Mid-fidelity Figma prototypes enabling interaction and concept exploration. Live iteration during interviews allowed participants to co-shape designs in real time.

Participants

30 menstruating individuals with 3–5 years average tracking experience

30
Semi-structured interviews
2
Interactive prototypes
⚠️ Design Decision

Live co-editing of Figma files during interviews enabled real-time design iteration. Participants actively shaped interfaces through feedback rather than just focusing on evaluating the presented features.

Design Concepts

MenstrualMate
Body-Centric, Embodied Design
Mid-level prototypes from design workshop

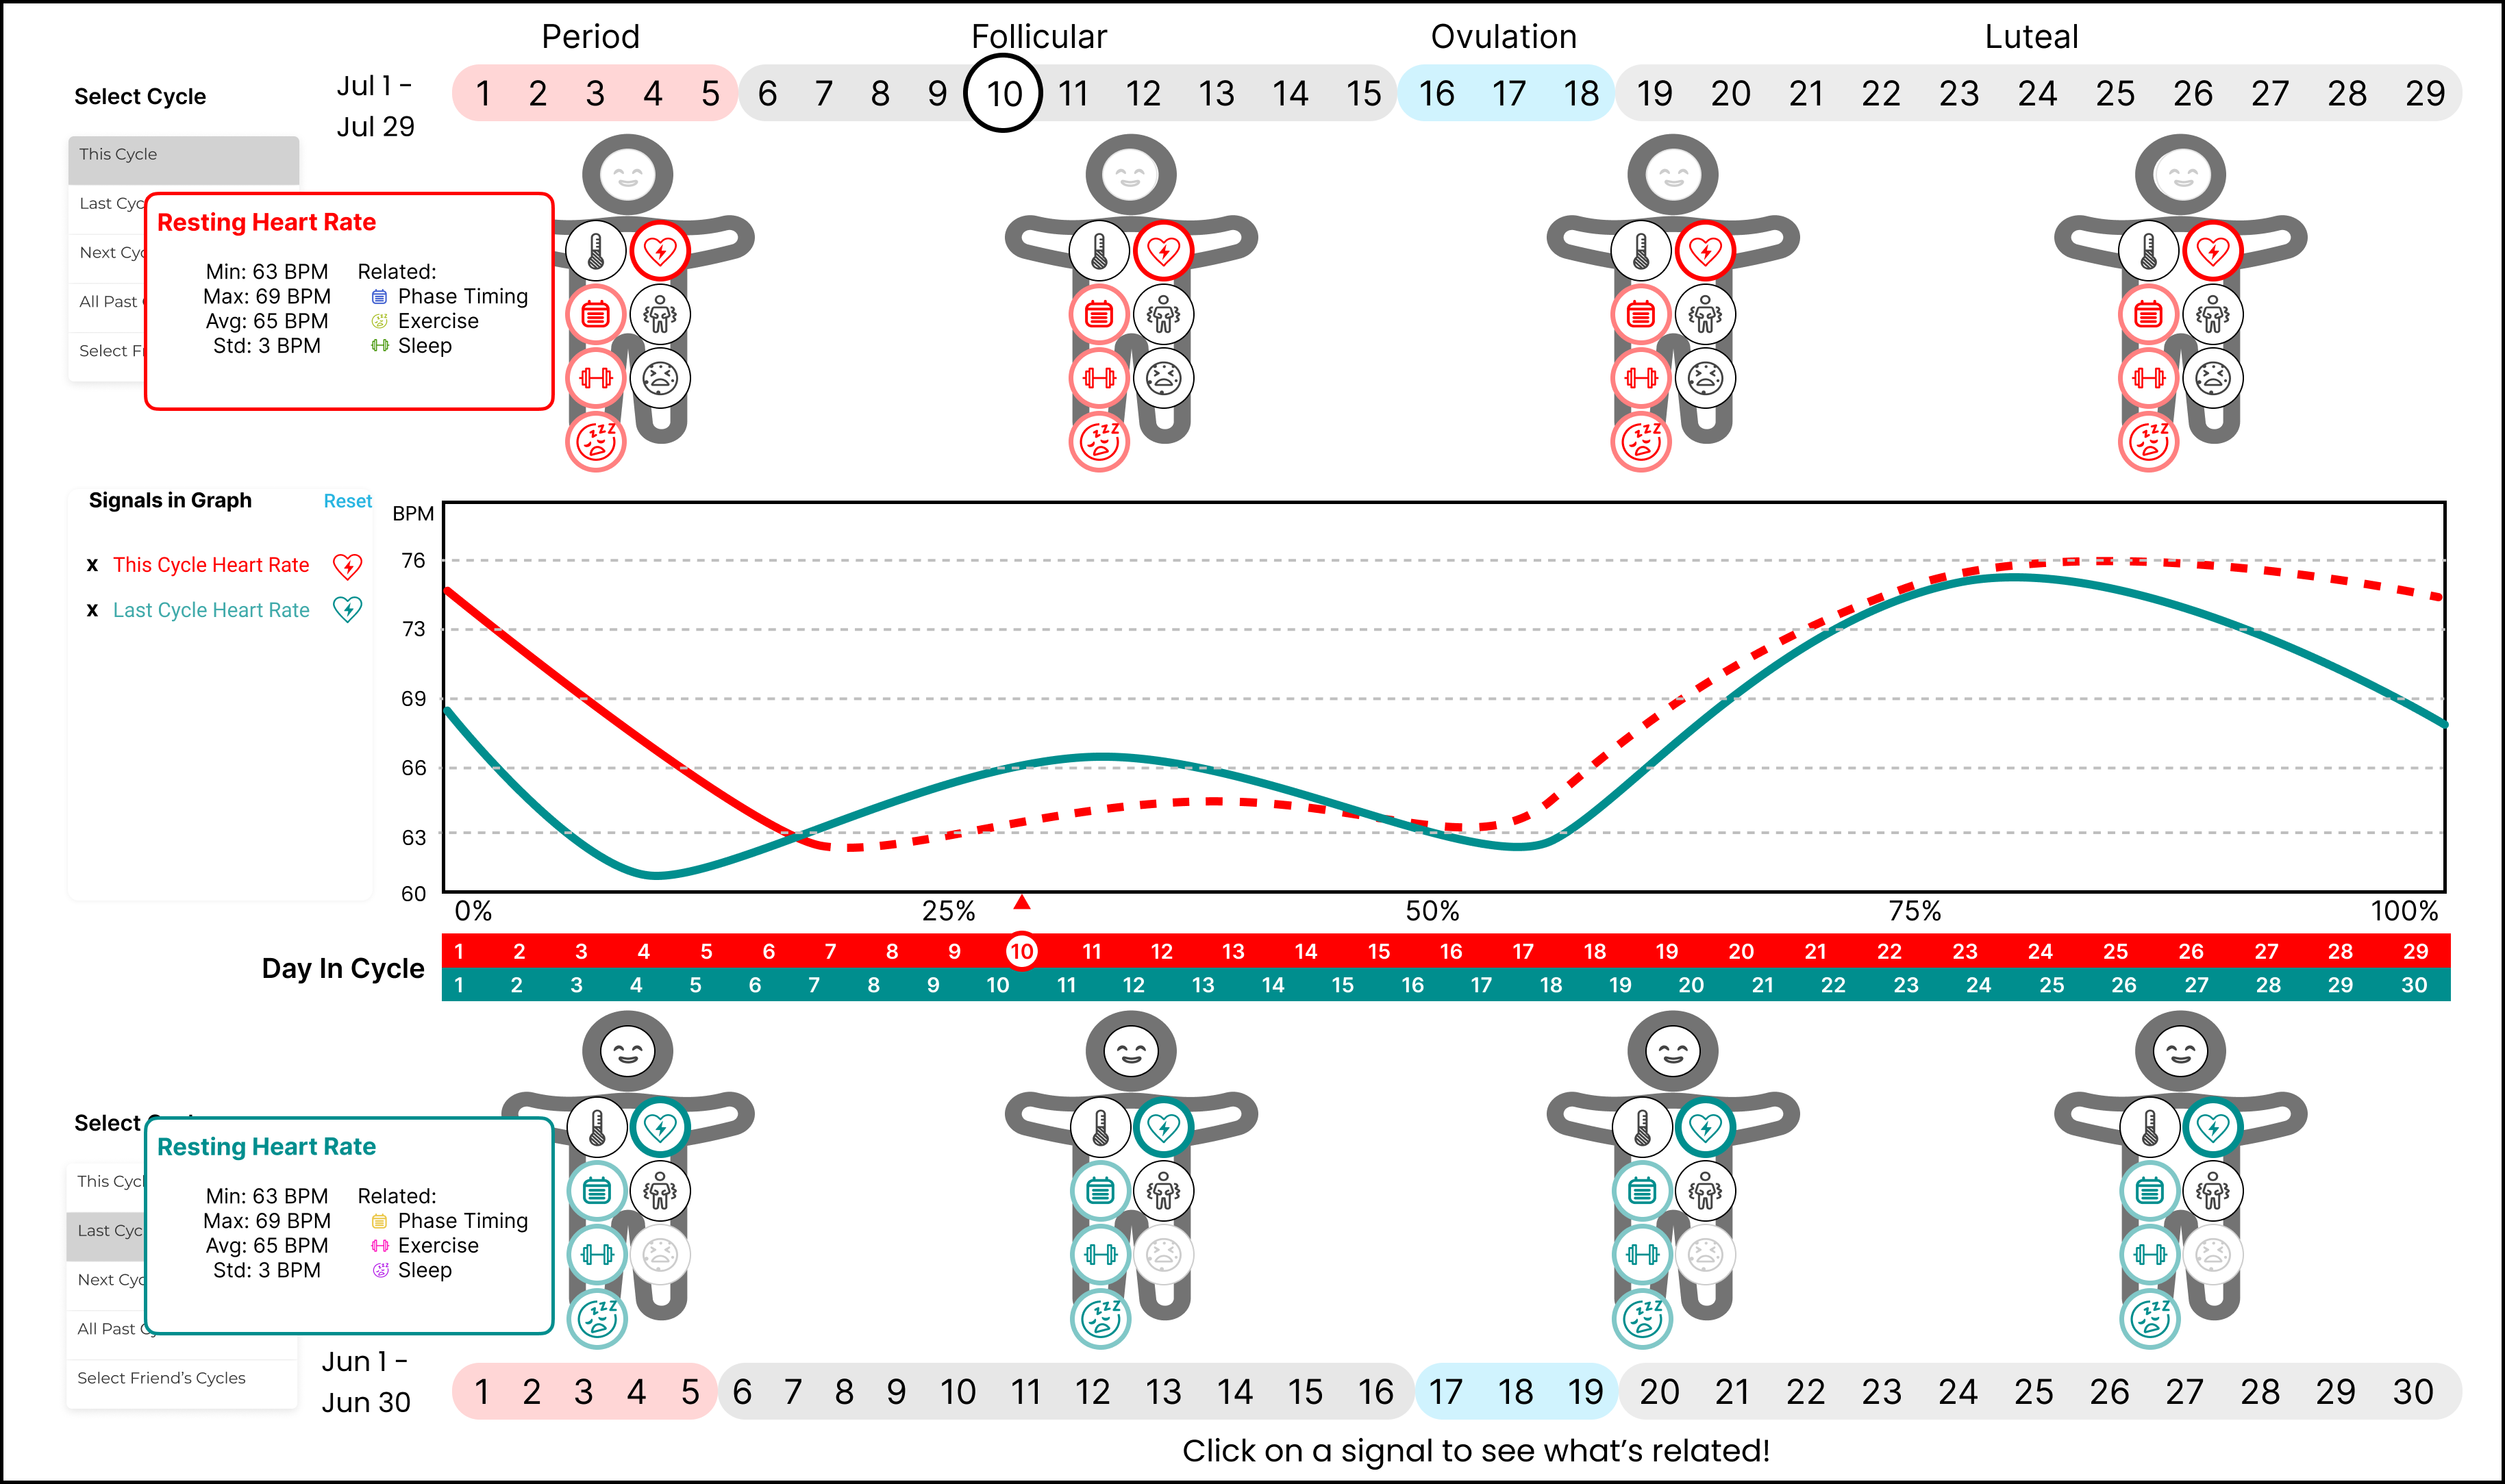
Concept: Human-avatar interface visualizing symptoms and health signals on a body figure over a linear timeline.

  • Linear calendar view shows past/future phases
  • Body-based icons map symptoms to relatable areas
  • Phase-specific stats for each symptom
  • Cycle comparison with historic + peer data
  • Signal plotting with stackable, independent y-axes
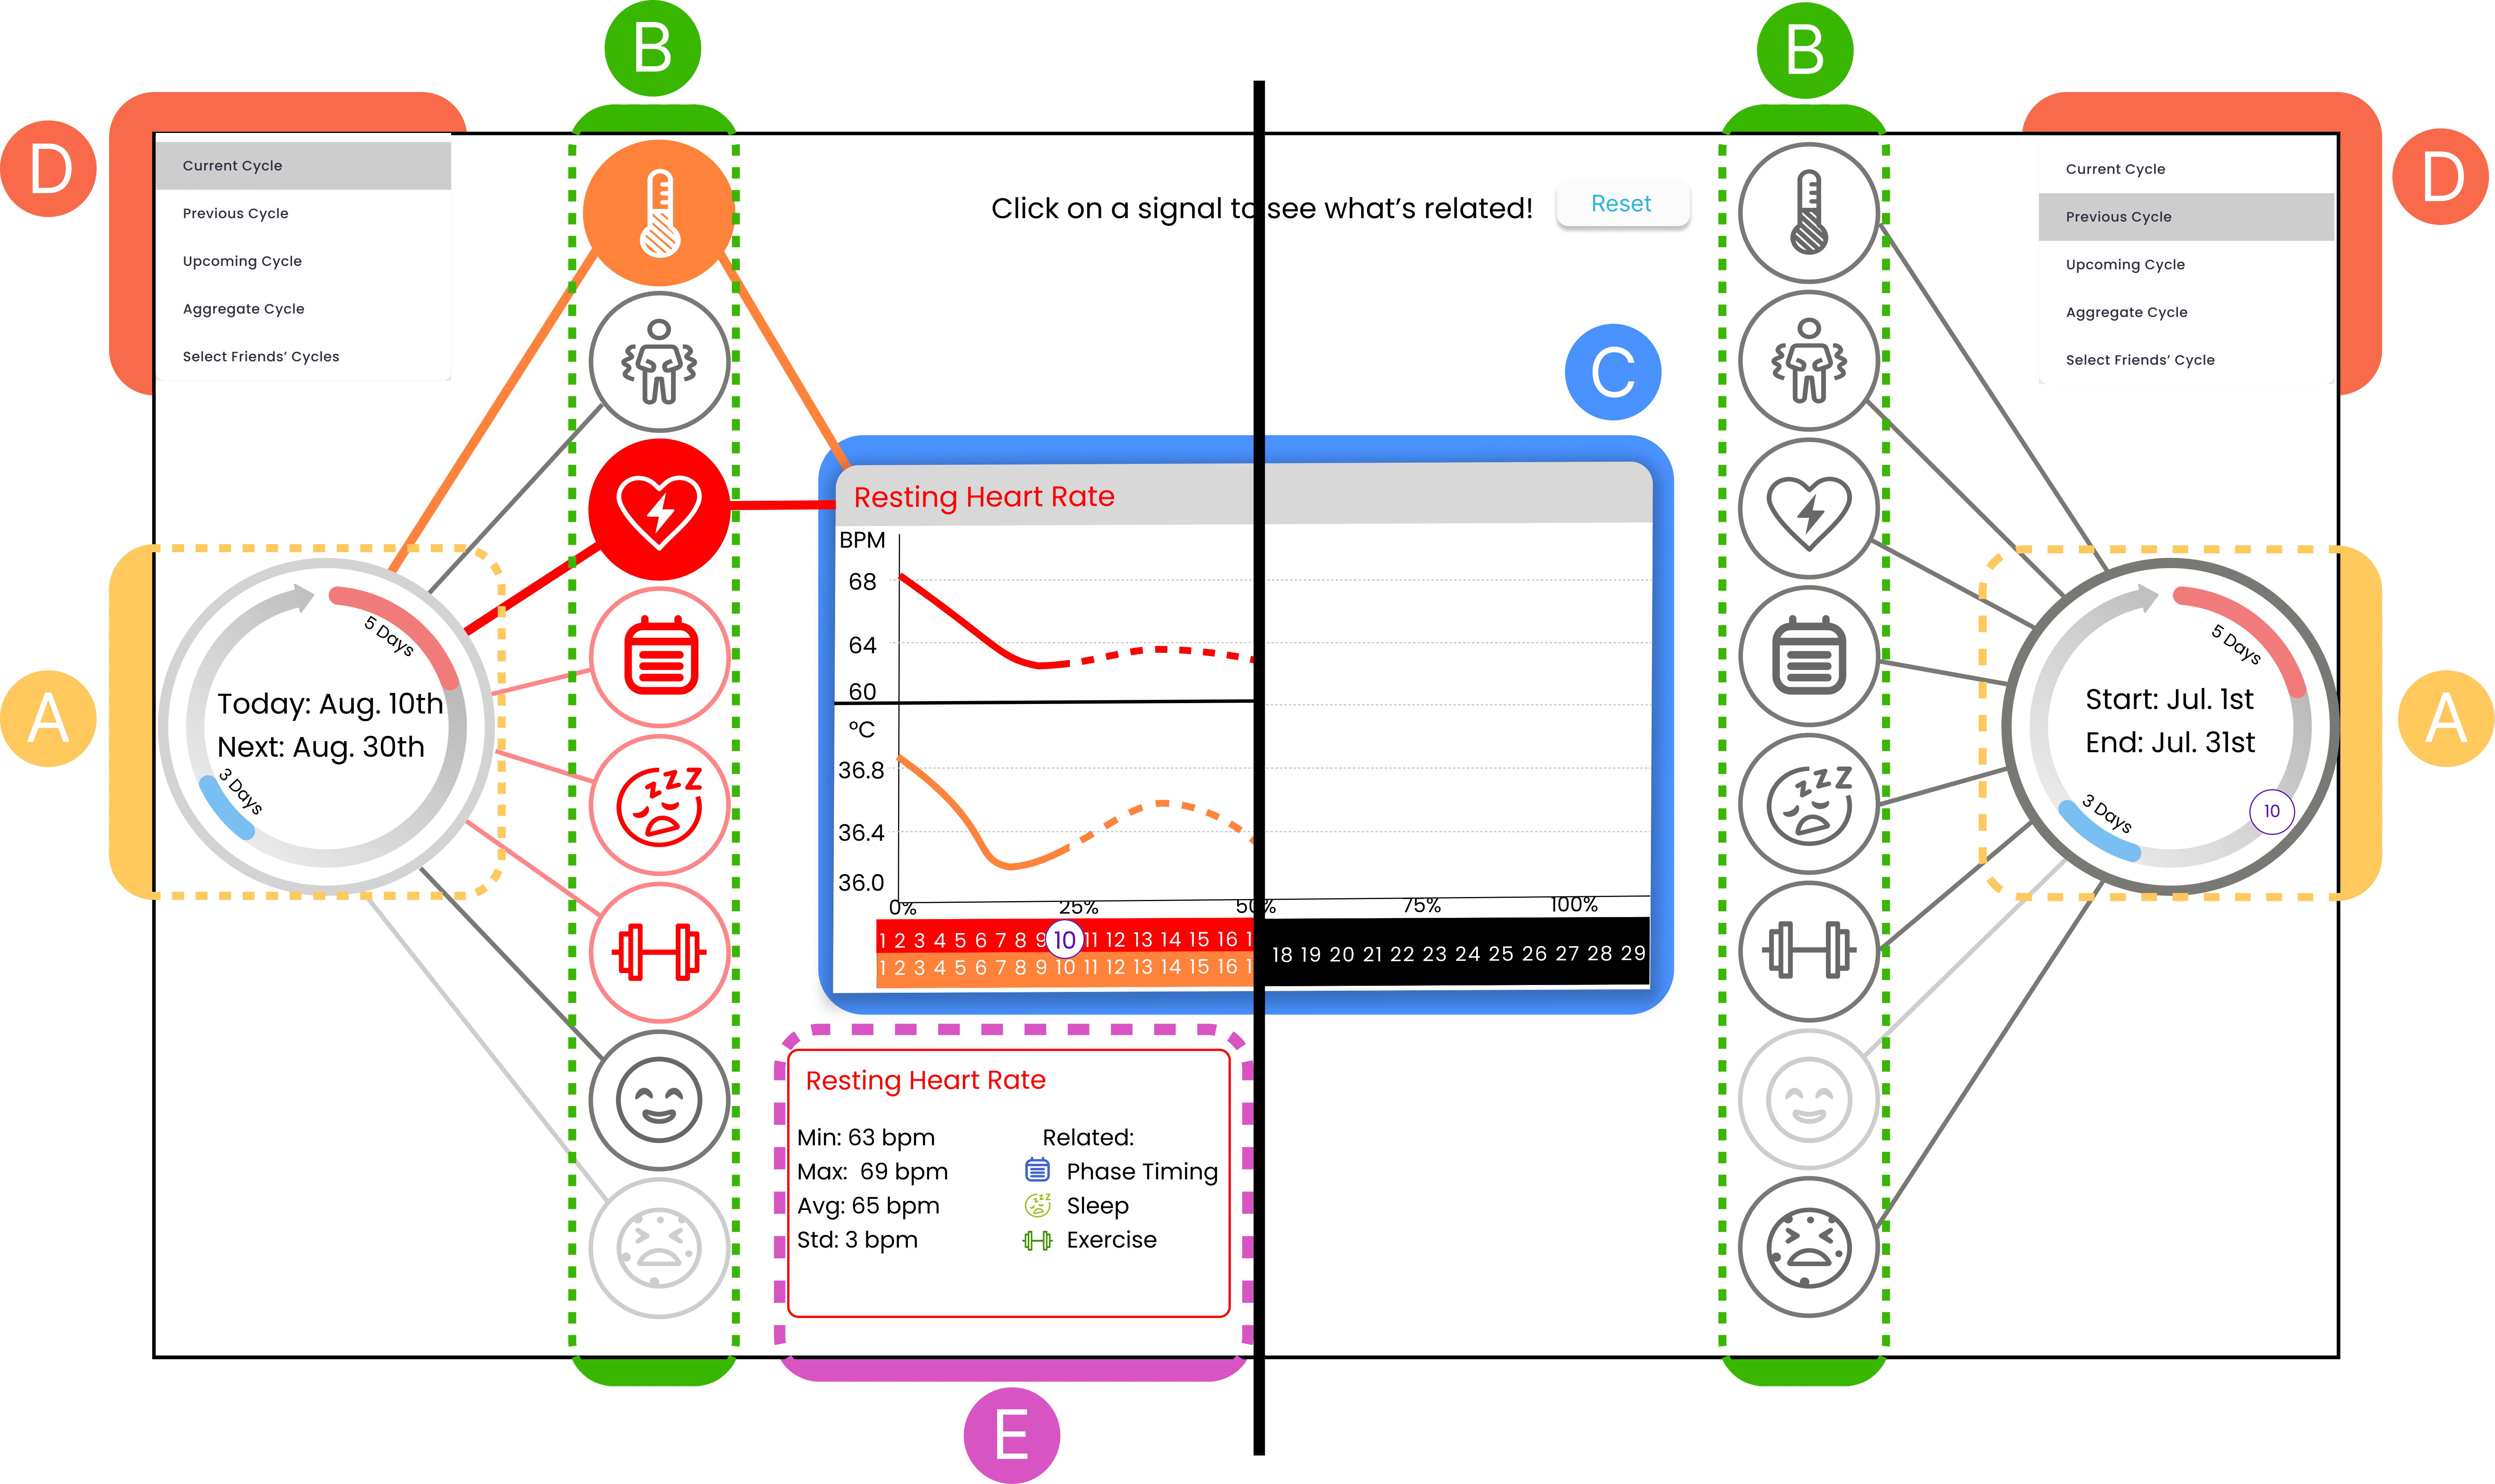
PeriodBubble
Graph-Based, Data-Relational Design
Mid-level prototypes from design workshop

Concept: Node-link graph visualization presenting health signals as connected nodes orbiting around a cycle hub.

  • Circular timeline reinforces cyclical nature
  • Signal nodes with relationship highlights
  • Drag-and-drop signal comparison in unified chart
  • Summary popups with min-max/avg values
  • Support for peer data & aggregate views

Key Findings → 5 Functional Design Requirements

User feedback across prototypes consistently mapped to five core needs
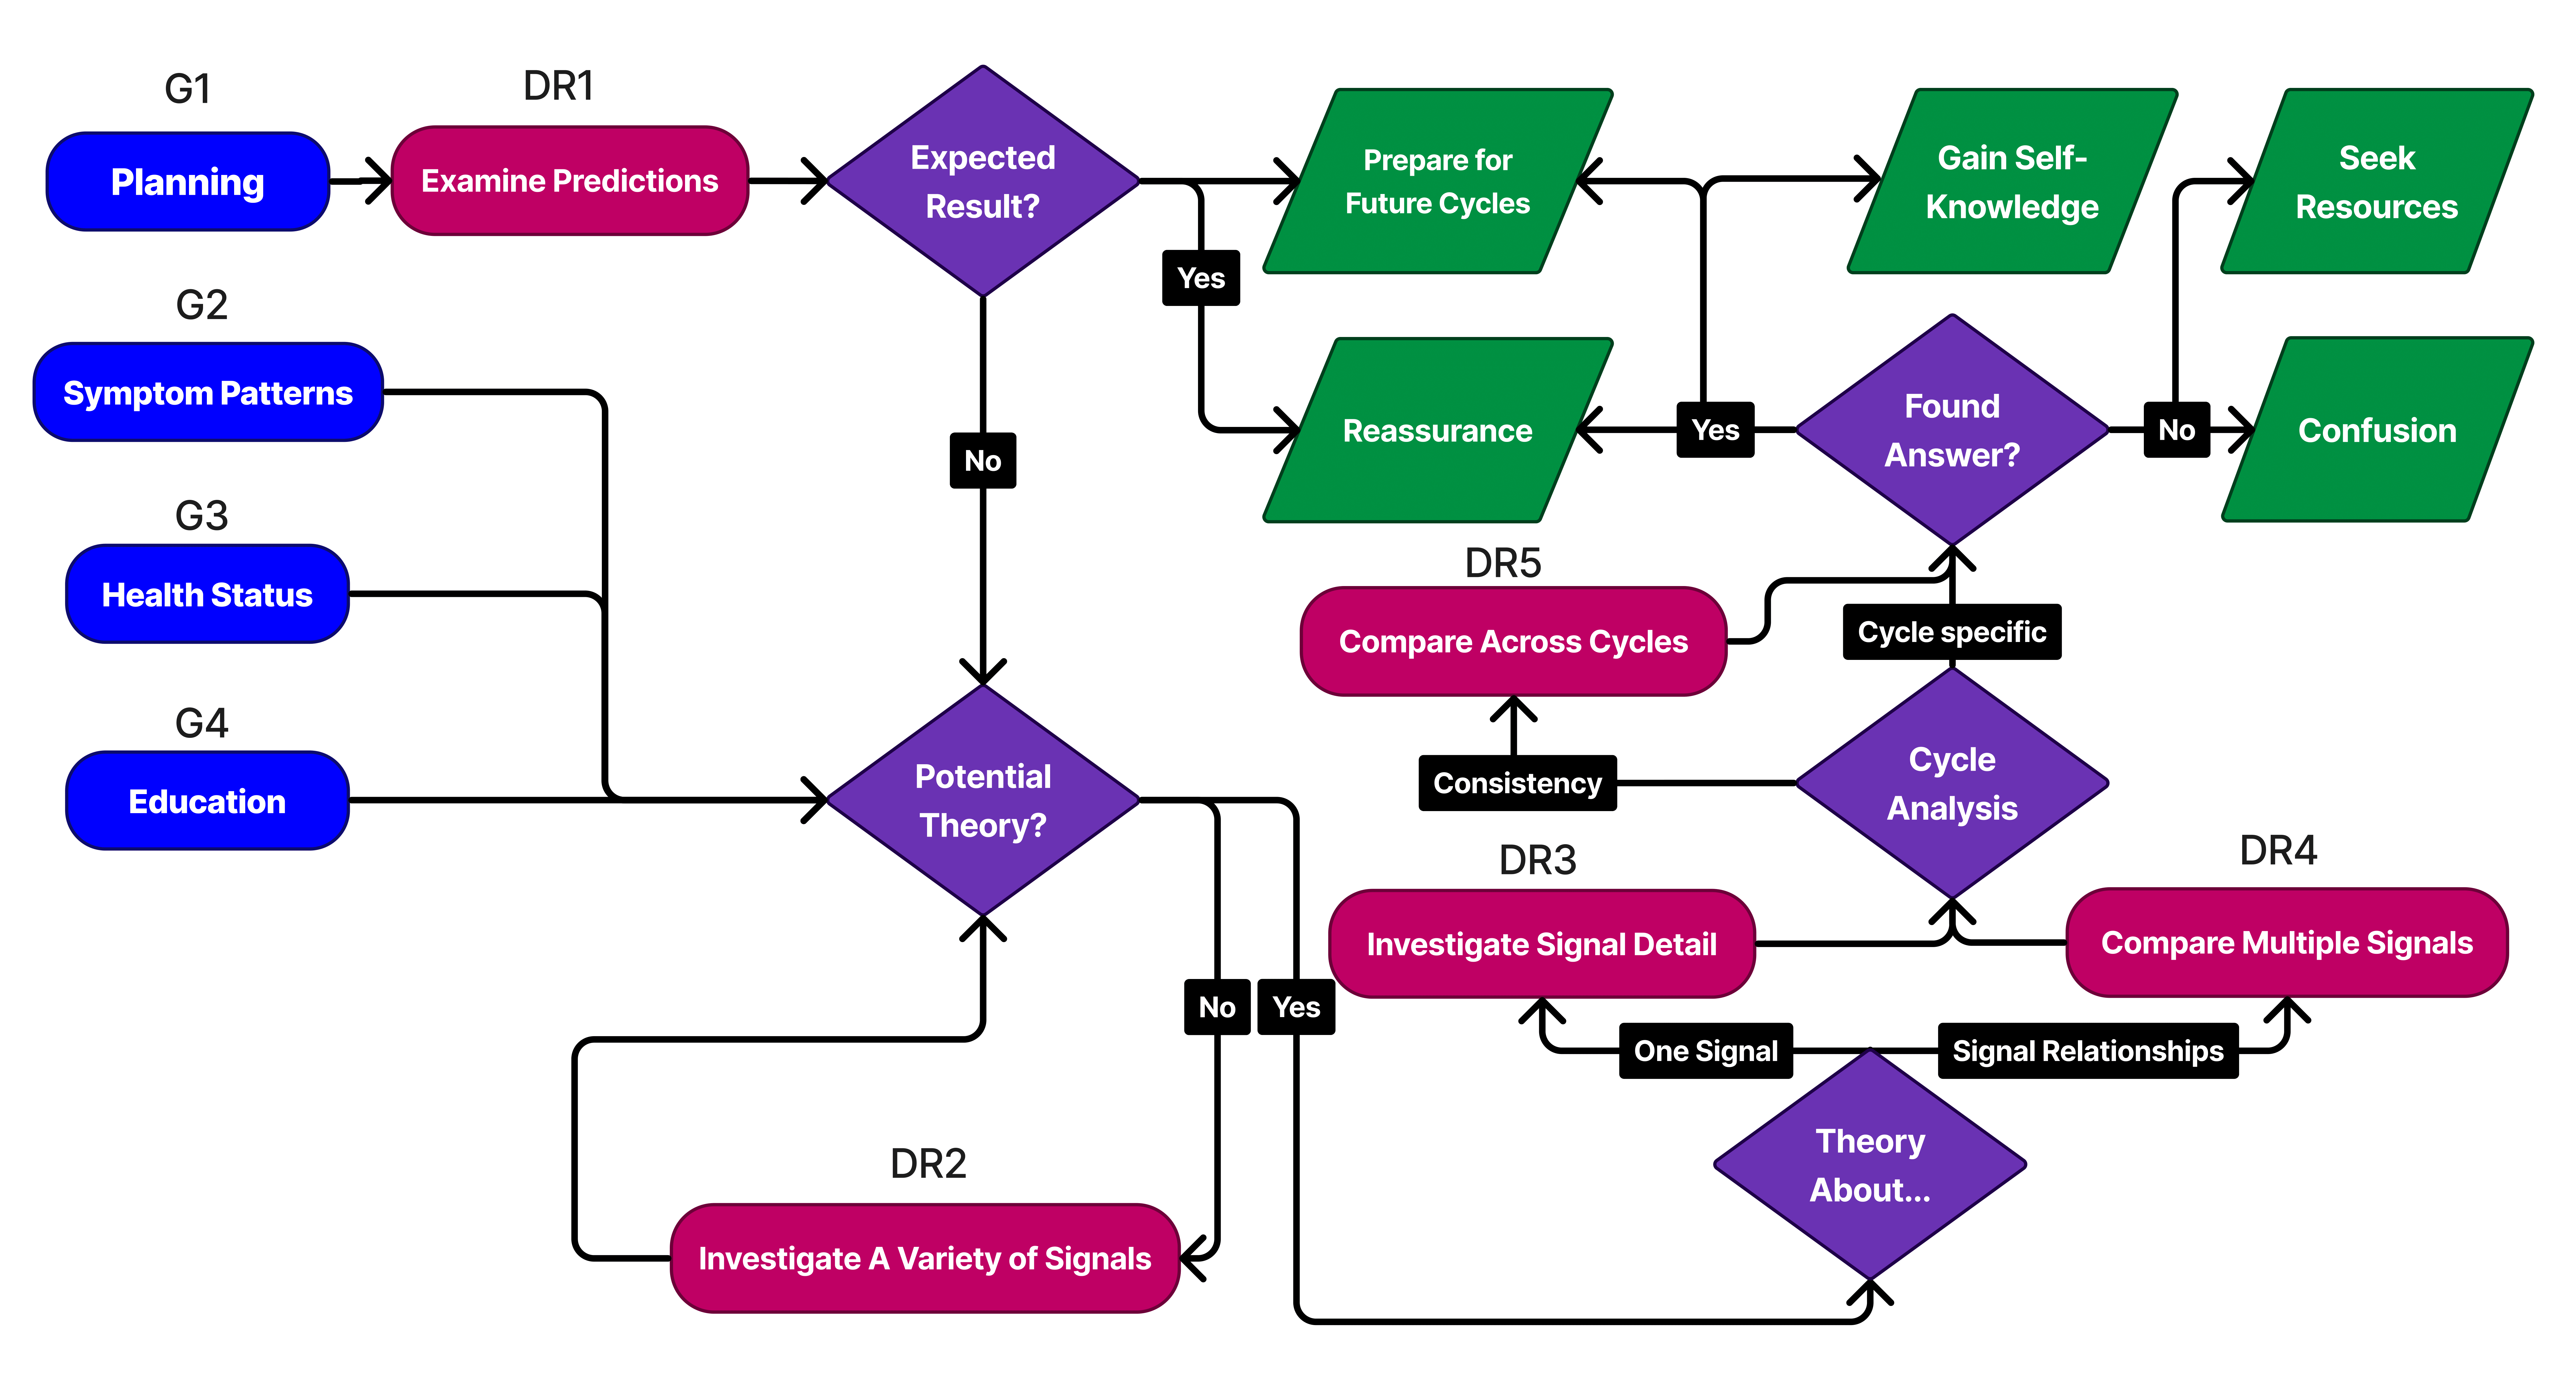
DR1 – Predict symptoms and events
Help users anticipate upcoming phases and prepare proactively. Linear and circular visualizations needed for planning ahead and mapping to cyclical trends.
DR2 – Support multivariate data
Display multiple data types (hormones, sleep, mood) in one unified view sorted by personal relevance and actionability.
DR3 – Inspect individual signals
Allow detailed drill-down on a single metric when needed with information on clinical relevance.
DR4 – Compare across signals
Make it easy to spot relationships between symptoms and physiological data and reconcile similar timescales.
DR5 – Compare across cycles
Support time-based reflection (past, present, predicted, peer cycles) given demographic context.
03

Build, Deploy, and Evaluate: Testing a Multimodal Health Tracker

Longitudinal field study of a working prototype integrating multiple health data streams

📍 20 participants ⏱️ 100 days 📱 Custom mobile app 📊 3 data integrations

Research Goal

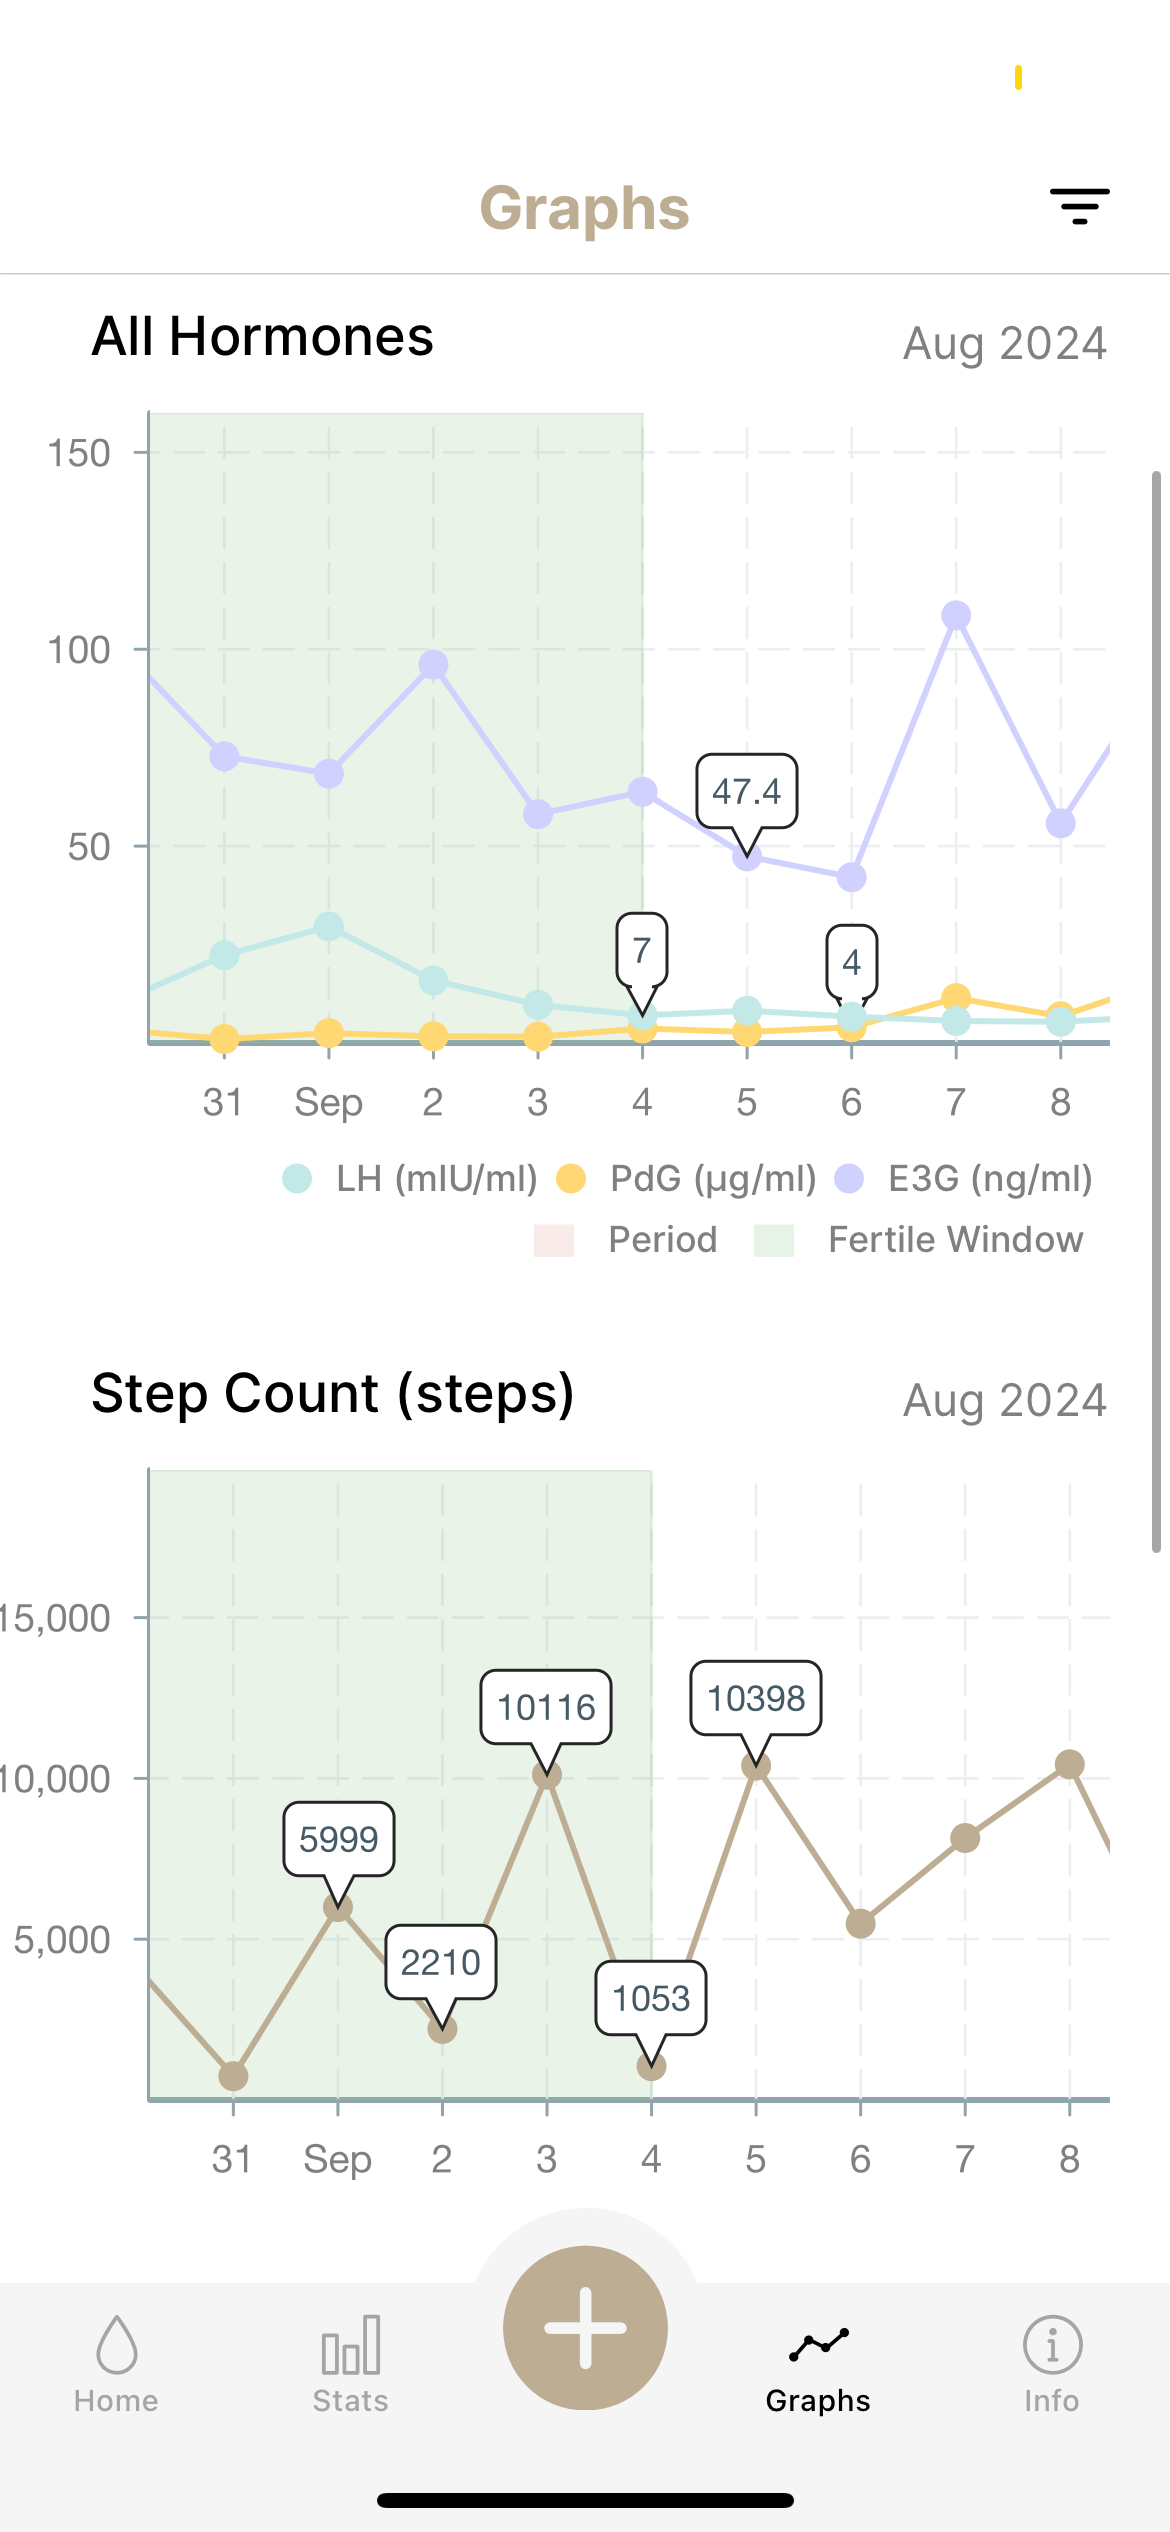
Building on Phase 2's functional requirements, I developed a working prototype integrating menstrual, physiological, and subjective signals into a single interface.

  • How people interpret and reflect on interconnected signals over time
  • Whether integrated tracking fosters insight, confidence, or lasting behavioral change
  • How tools can reduce cognitive load of long-term health engagement

Methodology

Approach

100-day longitudinal field study with mixed-method evaluation focusing on lived engagement, motivation, reasoning, and post-tracking impact

Participants

20 individuals (diverse in gender, race, goals) with prior health tracking experience

Data Collection Framework

Data Source Details Purpose
Custom App Logs Timestamped usage: time-on-app, screens viewed, comparison features used Behavioral patterns
Fitbit Integration Sleep, heart rate, activity data Physiological signals
Mira Integration Hormone levels (E3G, LH) Cyclical patterns
Biweekly Reflections Open-ended check-ins via app Insight formation
Surveys and Interviews Pre/Post/Follow-up surveys and 60 minute semi-structured sessions Tracking goals and reflection
93
Average days tracked
54+
Surveys
20+
Hours interview

Analysis Approach

Quantitative Log Analysis

Usage modeling: Average session duration, signal comparison frequency over time

Feature mapping: Connected feature use to participant goals and reflection content

Qualitative Coding

Open coding: Captured cognitive strategies, emotional states, behavioral shifts

Thematic triangulation: Compared app usage traces with interview narratives and journaled reflections

Key Findings

1
Multimodal integration enabled "big picture" health understanding

Participants moved from "logging" to connecting and seeing how physiological signals and hormones influence one another across the cycle.

  • Viewing all signals in one place helped surface relationships
  • Users broke out of single-device thinking (Fitbit vs. Mira)
  • Overlaying abstract data (hormones) with felt experiences increased trust
2
Engagement fluctuated as patterns were internalized

Usage patterns revealed a potential learning curve as users developed internal health models.

  • Early weeks: High engagement (~19.3 min/day) during pattern discovery
  • Mid-study: Sharp decline (~46-51 sec/day) as patterns internalized
  • Late resurgence: Return to active use (~7.6 min/day) for new insights
3
Users developed lasting internalized models

Many participants retained insights and applied them beyond the study period.

  • Recognized recurring patterns (e.g., energy dips post-ovulation)
  • Changed planning for exercise, work, and rest based on insights
  • Several stopped daily tracking but maintained pattern awareness
  • Some returned periodically to confirm or explore new patterns

Technical Implementation

App architecture diagram
Platform & Integration Details

Mobile App: React Native for cross-platform deployment

Data Integration: Real-time sync with Fitbit Web API, Mira Cloud API

Analytics: Custom event tracking for detailed usage logging

Backend: Node.js with PostgreSQL for participant data management

⚠️ Technical Decision

Built data normalization layer to handle different device sampling rates and data formats. This enabled seamless cross-signal comparison despite varying temporal resolutions (e.g., continuous glucose vs. daily hormone readings).

Design Implications & Next Steps

Design Goal Short-Term Actions Long-Term Vision
Expand users' perception of menstrual health beyond menstruation
  • Predict all menstrual phases from logs
  • Add tutorials & tips explaining cycle and lifestyle links
Menstrual health recognized beyond reproduction and integrated into education, public health, and social norms as a vital sign.
Help users identify meaningful correlations in menstrual data
  • Log and correlate lifestyle/events with symptoms
  • Overlay signals like HR or temp
  • Create customizable dashboards
Real-time trend detection powered by AI and professionals, with clear insights into user-specific patterns.
Support goal-setting and decision-making
  • Guided prompts for reflection
  • Example scenarios & recommendations
  • Track goals and provide check-ins
Tools evolve into proactive coaches offering cycle-aware, adaptive guidance and enhancing self-management.
Reflect diverse cycle experiences & set realistic expectations
  • Show variability in data visualizations
  • Debunk myths about "regular" cycles
  • Promote healthy observation over alarm
  • Enable filtered community discussions
Empower users with realistic literacy on normal fluctuations vs red flags, leading to better health decisions.
💡

Reflection

This research demonstrates the potential of multimodal tracking technologies to foster more comprehensive understanding of health. I identified new opportunities for designing personalized, adaptive tools that help individuals:
See connections across signals
Reflect on patterns in their own data
Build trust in the connection between their bodies and tools even when the data is complex or incomplete

References

2025

  1. graphs_multiple.png
    The Cognitive Strategies Behind Multimodal Health Sensemaking: A Menstrual Health Tracking Case Study.
    Georgianna Lin, Minh Ngoc Le, Khai Truong, and 1 more author
    Proceedings of the ACM on Interactive, Mobile, Wearable and Ubiquitous Technologies, 2025

2024

  1. sensemake.png
    Users’ Perspectives on Multimodal Menstrual Tracking Using Consumer Health Devices
    Georgianna Lin, Brenna Li, Jin Yi Li, and 3 more authors
    Proceedings of the ACM on Interactive, Mobile, Wearable and Ubiquitous Technologies, 2024
  2. vis.png
    Functional Design Requirements to Facilitate Menstrual Health Data Exploration
    Georgianna Lin, Pierre-William Lessard, Minh Ngoc Le, and 4 more authors
    In Proceedings of the CHI Conference on Human Factors in Computing Systems, 2024